1 Season
6 Episode
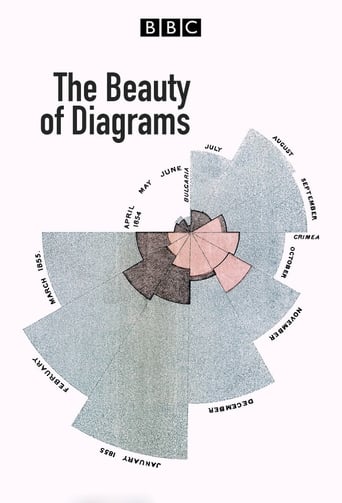
The Beauty of Diagrams - Season 1 Episode 4 The Rose Diagram, Florence Nightingale
A look at Florence Nightingale's use of statistical graphics as a call to action following her experience of caring for soldiers during the Crimean War of 1854-1856. She compiled her findings into a report featuring the Rose Diagram, which explained how 16,000 of the conflict's 18,000 deaths were a result of infectious diseases found in hospitals, and was used to persuade the British government to improve sanitation.
- Year : 2010
- Country :
- Genre : Documentary
- Studio : BBC Four
- Keyword :
- Director :
- Cast : Marcus du Sautoy


 "
"